New Monitoring Capabilities for IBM Middleware Added to IBM Observability by Instana
By Xiao Li Duan
May 25 2021
This blog post was originally published by IBM
What is IBM Observability by Instana?
IBM Observability by Instana provides businesses with advanced application performance monitoring and observability capabilities, manages the performance of complex applications and software no matter where they reside and accelerates the efficiency of IT operations teams, development teams and DevOps teams. IBM Observability by Instana can be integrated with the IBM Cloud Paks (e.g., IBM Cloud Pak® for Integration and IBM Cloud Pak® for Watson AIOps):
Existing monitoring capabilities for IBM Observability by Instana
IBM Observability by Instana provides smart and comprehensive monitoring of IBM middleware (e.g., IBM MQ, WebSphere Liberty and IBM DB2) and IBM products integrated with WebSphere or Liberty (e.g., IBM Maximo server, IBM Business Process Manager (BPM) and IBM Operational Decision Manager (ODM)). IBM continues to expand the capabilities around the IBM middleware portfolio, and we have recently added the ability to use IBM Observability by Instana to monitor IBM App Connect Enterprise, IBM Integration Bus and IBM DataPower. We will continue to enhance and expand our coverage of IBM middleware products.
New monitoring capabilities for IBM Observability by Instana
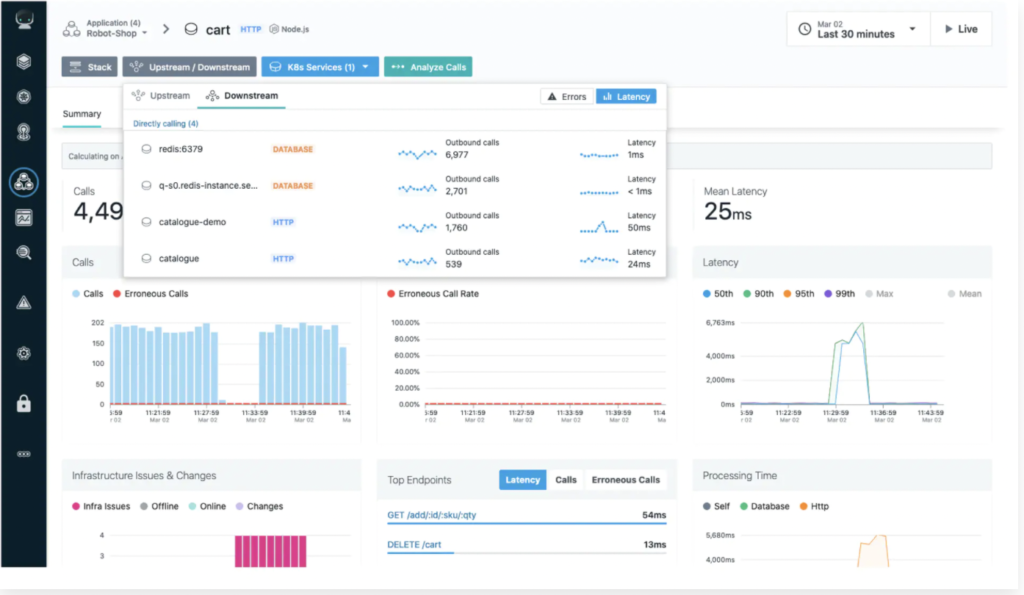
IBM Observability by Instana can now monitor IBM DataPower Gateway, IBM Integration Bus and IBM App Connect Enterprise in the context of your business applications, providing a built-in dashboard that displays key metrics and health events. It provides the following capabilities when monitoring these services:
- Automatic discovery of IBM App Connect Enterprise/IBM Integration Bus in both traditional and cloud environments.
- The ability to monitor all forms of IBM DataPower and IBM App Connect Enterprise/IBM Integration Bus in both traditional and cloud deployments.
- Out-of-the-box threshold and dashboards by leveraging years of IBM experience to help you detect problems with your DataPower and App Connect Enterprise/Integration Bus environments.
- IBM DataPower monitoring includes the health of the DataPower appliance and the performance of the services that are used by your application with out-of-the-box dashboards and alerts.
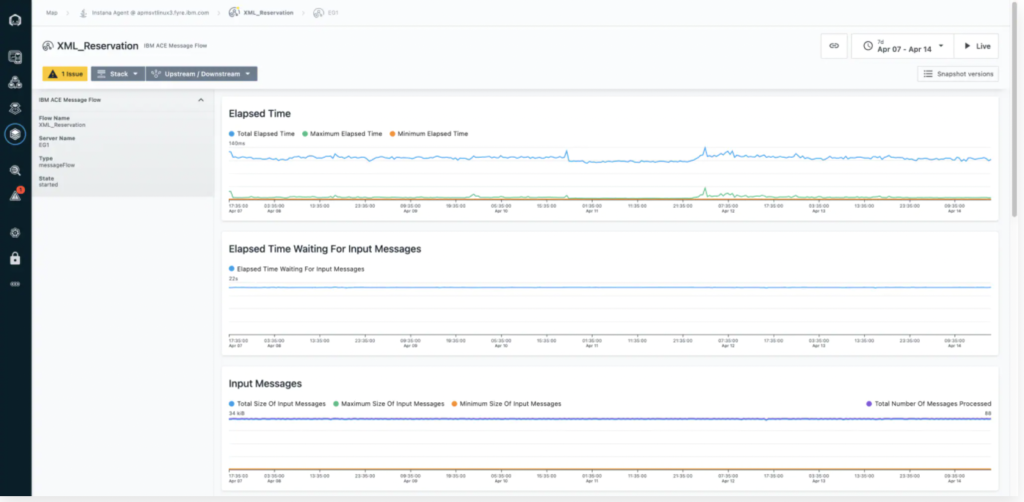
- IBM App Connect Enterprise/IBM Integration Bus monitoring includes the health and performance of App Connect Enterprise/Integration Bus and the performance of each message flow.
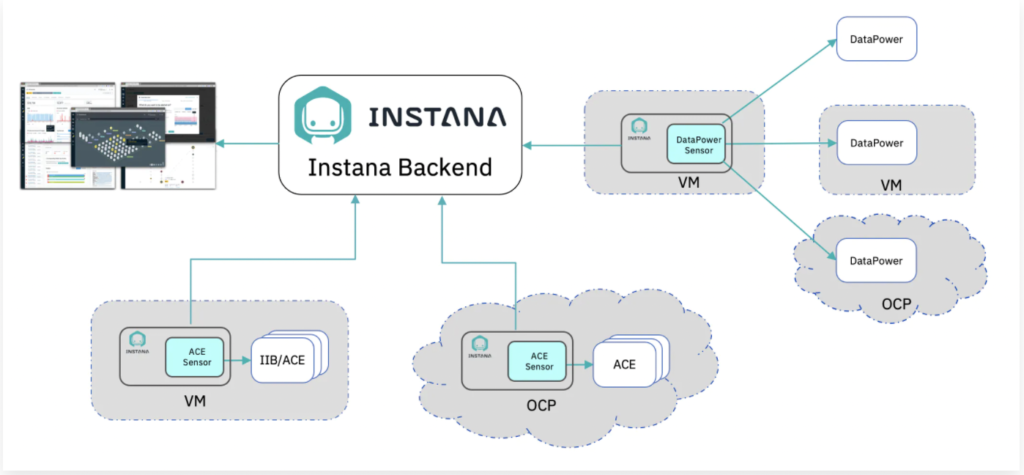
The following graphic for scenarios shows where you can deploy IBM DataPower and IBM App Connect Enterprise/IBM Integration Bus:
Metrics of IBM DataPower and App Connect Enterprise/IBM Integration Bus monitoring
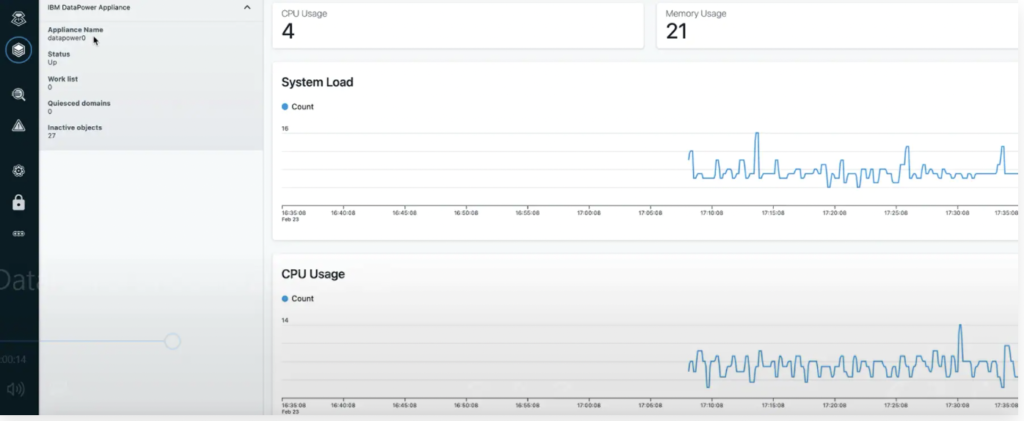
For IBM DataPower monitoring, IBM Observability by Instana collects the following performance metrics:
- Appliances metrics (e.g., System Load, CPU Usage, Memory Usage, etc.)
- Current memory usage of domains
- Ethernet Interfaces metrics (e.g., RX Bytes, RX Drops, TX Bytes, etc.)
- MQ Queue Manager metrics, including Backend Active Connections and Frontend Active Connections
- Services metrics, including Current Memory Usage, Mean Transaction Time and Throughput
- Active connections of SQL data source
Learn more about the IBM DataPower metrics.
For IBM App Connect Enterprise monitoring, IBM Observability by Instana mainly collects the following metrics:
- Performance metrics
- Integration server (e.g., Initial Heap Memory, Used Heap Memory, Committed Heap Memory, etc.)
- Message flow (e.g., Total Elapsed Time, Maximum Elapsed Time, Number of Transaction Commits, etc.)
- Message flow node (e.g., Total Elapsed Time, Number of Invocations, Number of Input-type Terminals, etc.)
- Configuration data (e.g., Default Queue Manager Name, Product Name, Version, etc.)
Learn more about the IBM App Connect Enterprise metrics.
Built-in events of IBM App Connect Enterprise, IBM Integration Bus and DataPower monitoring
IBM Observability by Instana can automatically detect common problems in IBM App Connect Enterprise/IBM Integrations Bus and DataPower by leveraging out-of-the-box events that are shipped with the solution.
Built-in events of IBM App Connect Enterprise/IBM Integration Bus
- Status of ACE Integration Server: Checks the status of ACE Integration Server
- Total number of messages with errors: Number of messages that contain errors
- Total number of MQ errors: Number of MQGET errors for MQInput nodes or Web Services errors for HTTPInput nodes
- Total number of errors processing messages: Number of errors while processing a message
- Message flow status: Checks the status of ACE Message Flow
Built-in events of IBM DataPower
- IBM DataPower Appliance
- Appliance percentage of CPU usage: Checks whether appliance percentage of CPU usage is too high
- Appliance percentage of memory usage: Checks whether appliance percentage of memory usage is too high
- Appliance percentage of system load: Checks whether appliance percentage of system load is too high
- Appliance status: Checks whether appliance status is not up
- IBM DataPower Domain
- Domain percentage of memory usage: Checks whether domain percentage of memory usage is too high
- IBM DataPower Service
- Service percentage of memory usage: Checks whether service percentage of memory usage is too high
Note: These events can be forwarded as alerts using Alert Channels (e.g., Slack, PagerDuty or IBM Watson AIOps). For more information, see here.
Getting started is easy
Adding IBM App Connect and DataPower delivers on IBM’s commitment to continually grow the functionality of IBM Observability by Instana, with more to come in future releases. Check out Instana by taking the guided tour, or request a trial account to try Instana for free with your own workloads.