How to use CP4I to build and deploy a Microservice in ACE
This tutorial will show you how in just a few minutes you can use IBM Cloud Pak for Integration (CP4I) to build a microservice that retrieves customer details from Salesforce and deploy this into your own ACE integration server.
We are using the IBM App Connect Designer in this example. The designer is a browser-based tool that helps you build simple integrations that can easily connect to software as a service (SaaS) applications like Salesforce and ServiceNow by leveraging the 100+ intelligent SaaS and cloud connectors and flow templates freely available out of the box.
App Connect Designer was created primarily for the “Citizen Integrator”, they are likely embedded in a line of business and have some basic integration needs. For example, a person working in the marketing department. The designer allows a non-integration specialist to perform this integration task themselves – without having to ask the IT department to get involved (i.e. adopting self-service model).
Previously these integrations were built and deployed in the cloud, however, a recent feature now allows you/citizen integrator to export these integrations and deploy them into your own ACE integration server on CP4I.
When using CP4I, all of the components are already provided for you inside your platform and this article will show how easy it is to build, deploy, log, trace, and monitor your microservice.
This example uses the ACE Dashboard to store a BAR file that is retrieved dynamically during deployment, this is entirely optional, however, the ACE Dashboard provides a nice user interface for you to manage your integration servers which you can see later in the article.
HIGH LEVEL SEQUENCE
- Develop microservice in App Connect Designer
- Export BAR file from App Connect Designer
- Deploy ACE Dashboard
- Upload BAR file to ACE Dashboard
- Configure authentication secrets
- Deploy ACE integration server with BAR file
- Verify microservice
- View logs, tracing, and monitoring
DETAILED STEPS
STEP 1 – DEVELOP MICROSERVICE IN APP CONNECT DESIGNER
Our microservice consists of a simple flow that processes an API request, logs an application message, and then uses a Salesforce connector to retrieve customer details from a customer ID request parameter.
All you need to do is to create the request model, configure the “Retrieve contacts” operation in the Salesforce connector, and provide your Salesforce account details, there is no coding involved at all making it very easy for a citizen integrator to configure and test.

A detailed App Connect Designer tutorial is beyond the scope of this article, however, plenty of tutorials on how to use App Connect Designer can be found here
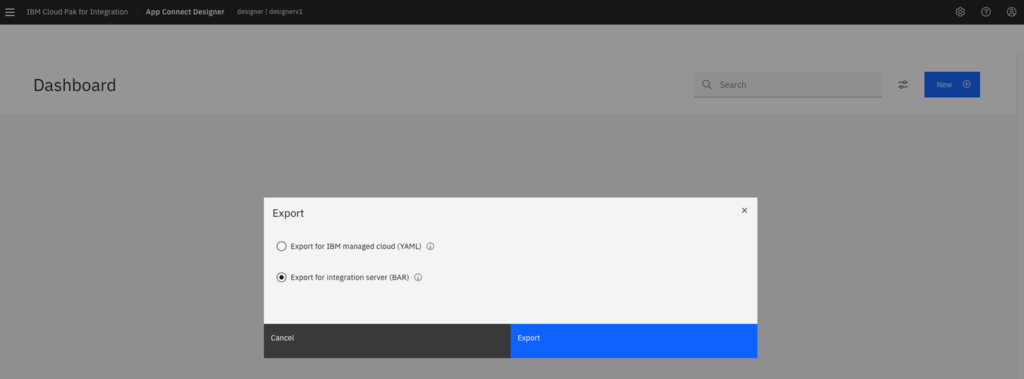
STEP 2 – EXPORT BAR FILE FROM APP CONNECT DESIGNER
After completing the integration we export it as a BAR file.
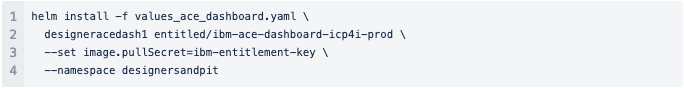
STEP 3 – DEPLOY ACE DASHBOARD
Before deploying the microservice we deploy the ACE Dashboard using a Helm chart, the ACE Dashboard only needs to be deployed one per project and then you can use this instance to manage all of your integration servers.
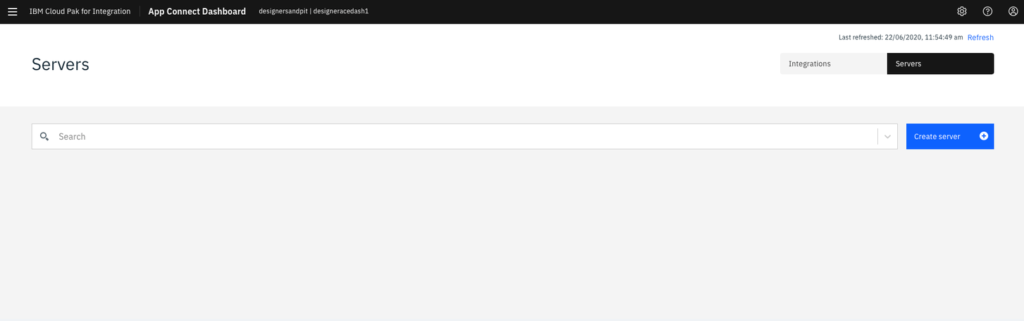
After deployment, you will see an empty ACE Dashboard similar to the one below.
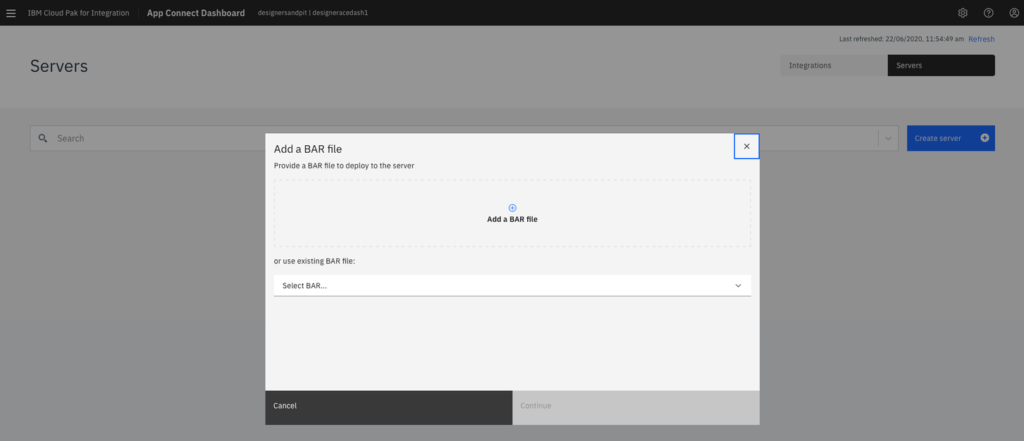
STEP 4 – UPLOAD BAR FILE TO ACE DASHBOARD
By uploading the BAR file into the ACE Dashboard you can reference this BAR file to quickly spin up ACE integration server instances.
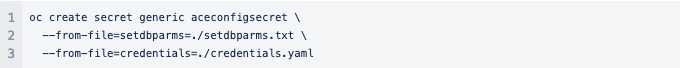
STEP 5 – CONFIGURE AUTHENTICATION SECRETS
Now we need to provide authentication information, the microservice needs to be secured with a secret identifier and the Salesforce connector requires authentication credentials. We provide these authentication details to OpenShift and CP4I by creating a secret.
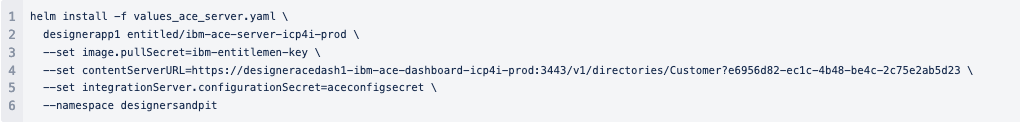
STEP 6 – DEPLOY ACE INTEGRATION SERVER WITH BAR FILE
Finally we deploy our ACE Integration server using a Helm chart, note the url of the BAR file points to the BAR file inside the ACE Dashboard we uploaded earlier, and the ACE configuration secret is the one we created in our last step.
STEP 7 – VERIFY DEPLOYED MICROSERVICE
Within the ACE Dashboard, you can see that our microservice has been deployed.

We can now run a curl command that includes our authentication credentials to test our microservice

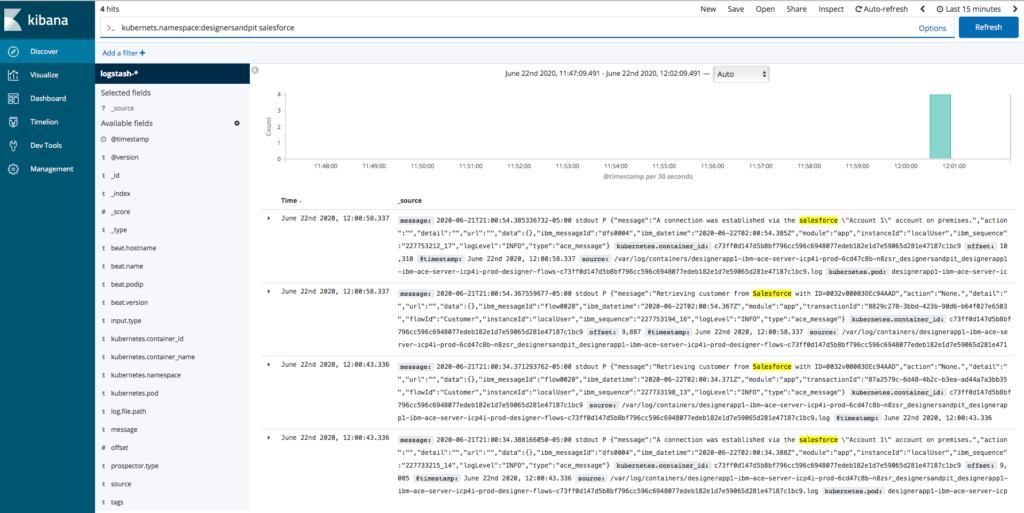
STEP 8 – VIEW LOGS, TRACING, AND MONITORING
After a successful test, we can view the microservice logs using Kibana, view detailed tracing information in the Operations Dashboard, and view Prometheus service metrics in Grafana.
VIEW LOGS IN THE CP4I KIBANA LOGS
VIEW TRACING IN CP4I OPERATIONS DASHBOARD

VIEW MONITORING METRICS IN CP4I WITH THE GRAFANA DASHBOARD

CONCLUSION
In just a few minutes we have created, deployed, and verified our application, and everything was made easier by using standard CP4I components ready to use out of the box.
If you would like to know more about CP4I you can read our other CP4I articles on our website or contact Syntegrity and we’ll be happy to discuss with you in person.
FIND OUT MORE