How To Monitor IBM MQ
By Rodoljub Radivojevic
September 14, 2020
IBM MQ (previously Websphere MQ and MQ Series) is an enterprise-oriented messaging middleware. According to the IBM website, “It works with a broad range of computing platforms, applications, web services and communications protocols for security-rich message delivery. IBM MQ provides a communications layer for visibility and control of the flow of messages and data inside and outside your organization.” It is well known for its reliability, speed, robustness, and security.
It was first released in 1993 as a messaging system for mainframes. Since then, it has continuously evolved and today provides message delivery for a significant range of areas, from the mainframes to mobiles and cloud platforms. According to the IBM website, 85% of the Fortune 100 and 98 of the top 100 global banks are using IBM MQ.

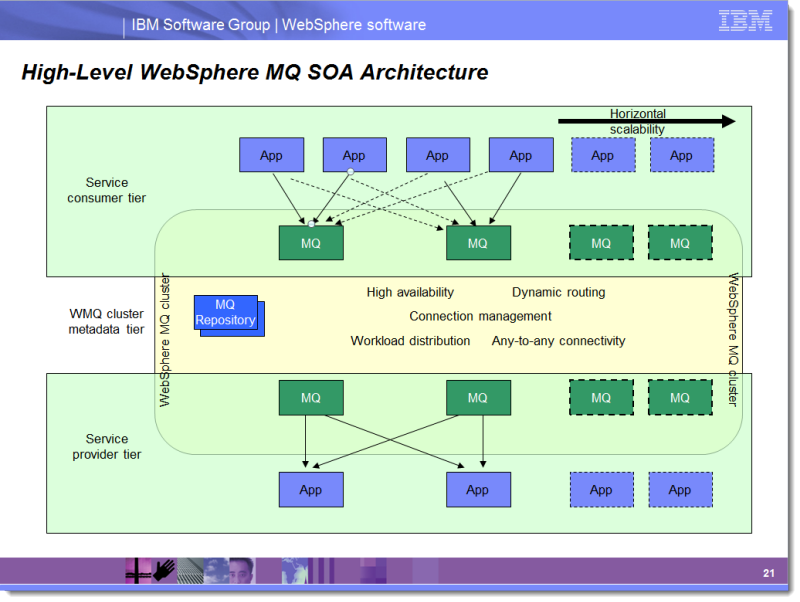
^Example of the IBM MQ architecture
How to monitor IBM MQ
IBM MQ is a central component that couples applications and services of different levels of complexity and different purposes. Monitoring IBM MQ configuration, performance and health provides the ability to detect issues, perform root cause analysis, and to detect bottlenecks.
The main building block of the IBM MQ is a queue manager. It is responsible for handling queues, adding messages to them, and for transferring messages to other queue managers using channels. Monitoring the health of queue managers, queues, and channels are essential from the operations point of view. One of the critical queue metrics that should be tracked is the current queue depth. Approaching current to max queue depth in some time frame indicates the necessity to scale the queue before it exceeds capacity.
Although IBM MQ is well known for its capability to not lose messages, in some cases messages will not be delivered to the destination. This message won’t be dropped but instead ends up in the dead letter queue. Message presence in the dead letter queue indicates that the destination queue doesn’t exist, is not reachable, or there is some other significant problem in the system.
IBM MQ is one of the best in class MQs in terms of message delivery speed and reliability. Therefore, it is crucial to monitor the age of the oldest message in the queue.
Monitoring IBM MQ with Instana
Instana IBM MQ monitoring works on all IBM MQ components: Queue Managers, Queues, Channels, Topics, and Listeners, as well as monitoring the whole cluster. By installing a lightweight Instana agent and providing credentials, the sensors are activated automatically and start collecting metrics for each configured Queue Manager instance and other corresponding entities (Queues, Channels, etc). All that in 5 minutes with minimal overhead. And not just that: the Instana agent doesn’t have to be installed on the same host as IBM MQ entities, it has the ability to remotely monitor IBM MQ.

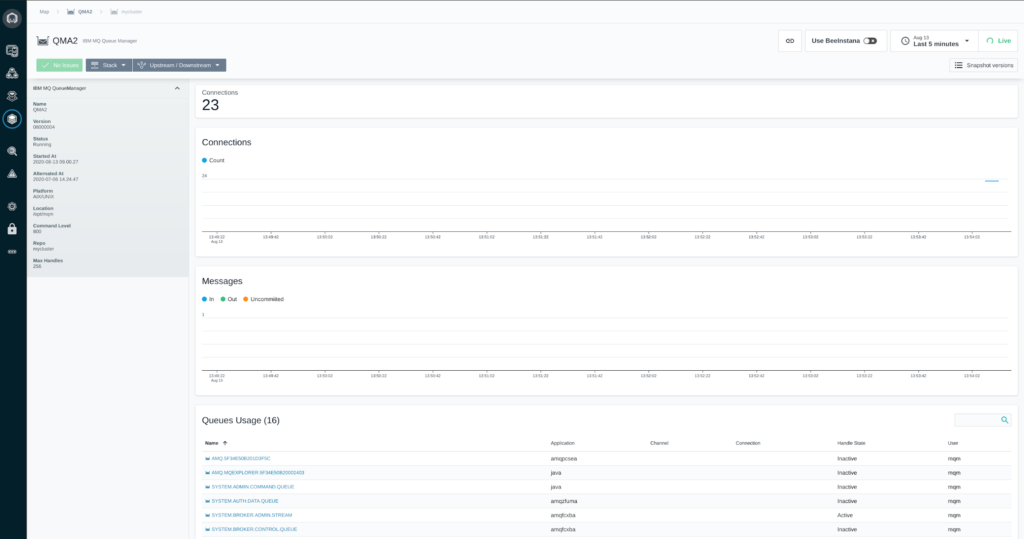
^Instana screenshot of Queue Manager dashboard
The Queue Manager dashboard shows KPIs, relevant metrics, and a list of corresponding Queues and Channels. From the Queue Manager dashboard, it is easy to navigate to Queue and Channel dashboards.

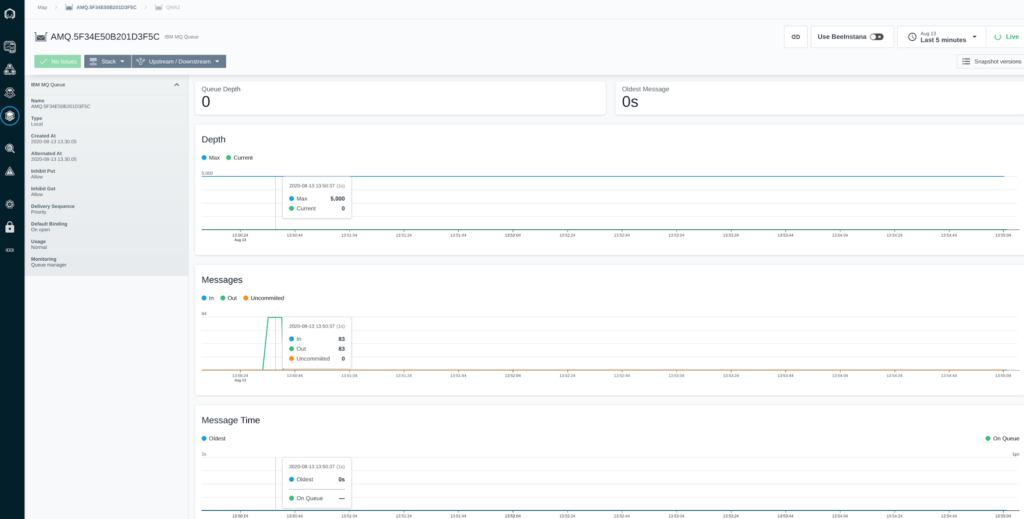
^Instana screenshot of Queue dashboard
Instana’s support for the IBM MQ also provides a comprehensive list of the built-in health events from the health statuses of the key components (Queue Managers, Channels, Listeners) to the depth and oldest message age for each Queue. In addition to built-in events, it is possible to create custom events and alerts for all collected metrics.
Instana’s IBM MQ monitoring includes automatic discovery, continuous delivery, dependency mapping, metric monitoring, anomaly detection, and analytics across the complete trace data set. A combination of these capabilities gives you a holistic view of IBM MQ and applications that communicate with each other using it. By this, Instana provides a powerful way for issue detection and resolution within seconds.
If you want to experience the full power of Instana’s IBM MQ monitoring you should sign up for a free trial of Instana and see for yourself.